K Nearest Neighbors (KNN) is a Machine Learning algorithm for classification — a classifier as the experts would call it.

Classification is a very fundamental and important activity we perform as humans. We’ve grouped animals, plants, stars, humans, music etc to help us understand them and their relationships better, among other things. Often, we need to classify a thing as part of one of several groups. This crucial activity gets boring to do though. What if computers could do that for us?
Teaching computers to classify things has been very tedious until Machine Learning. While hard-coded rules may work for a given problem set, everything falls like a pack of cards when a few parameters are added/changed/removed. Worse, a solution becomes useless when a new problem arises. That’s bad for business. 😠
The ML Chops series
- Linear Regression
- K Nearest Neighbors (this article)
- Naive Bayes
- Support Vector Machine
- K Means
Supervised learning
KNN is a supervised learning algorithm. Supervised learning algorithms infer from labelled training data. Say we want to determine whether a person is male or female, the following samples may be useful:
height (ft)    weight (kg)    sex
6.3            50.2           Male
5.9            79.7           Female
5.1            61.4           Female
5.6            47.1           Male
5.1            59.8           Female
Each row of training data (sample) represents a person. The sex column shows the labels while the height and weight columns show the features for each person. Good features translate to better classifiers. Height and weight are probably not the best features to train a classifier that determines the sex of a human being, but they are far better than Hair style or Eye color, for instance. Voice is a very good feature (I think).
Also, more training data means a better classifier because there are more examples to “learn” from.
Meet KNN
K Nearest Neighbors is probably the easiest classification algorithm to understand. Take a look at the following graph:
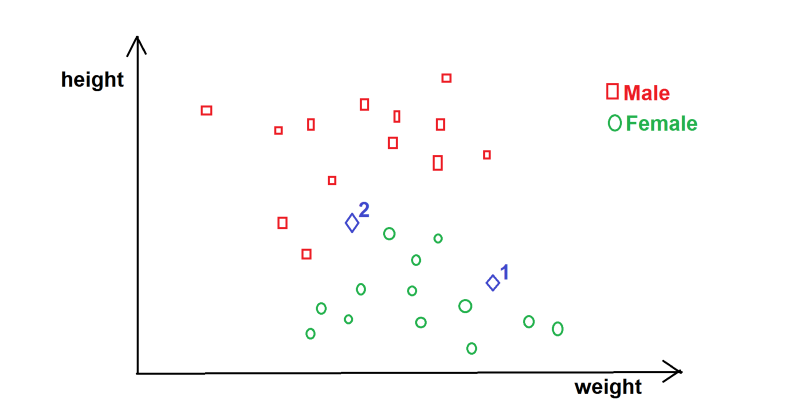
Graph of height vs weight (data is theoretical)
What would you classify Blue Diamond 1 as? At a glance, it’s easy to predict/infer that Blue Diamond 1 is most likely/is a Female. It seems logical to say that Blue Diamond 1 is in the cluster of Females so it’s female. Fair enough.
What of Blue Diamond 2? Not so fast! While it seems likely Female, one could argue it’s Male. Hmm… Eye-balling won’t cut it.
KNN provides us a pretty solid way to predict which class Blue Diamond 2 belongs to.
K Nearest Neighbors outputs a class membership of a feature set by a majority vote of its closest neighbors. In other words, we can find the persons closest to Blue Diamond 2 then cast a vote. If majority are Male, then we say Blue Diamond 2 is Male, else we say it’s Female.
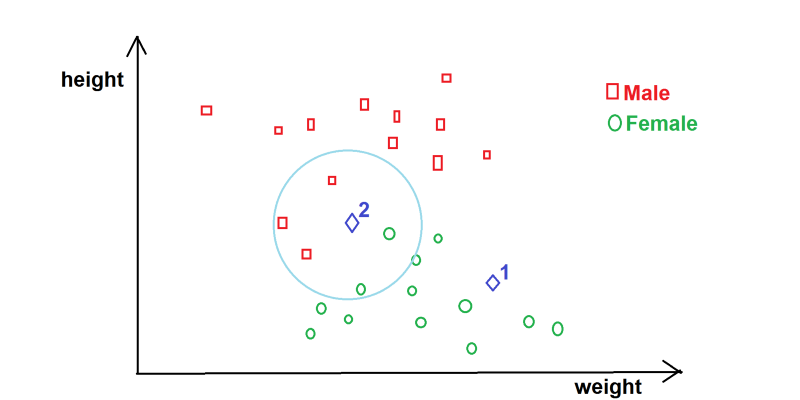
KNN visualization
Looking at the circled area, we can easily see from the graph (above) that there are 5 persons closest to Blue Diamond 2. 3 Red Squares and 2 Green Circles. KNN says Blue Diamond 2 is Male since males are the majority of the closest neighbors.
The k in KNN represents the number of neighbors being considered. In the case of classifying Blue Diamond 2, it’s 5. k directly affects our prediction so we must use a “good” value. Take into account your data, specifically the number of classes and the sample size of the training set when choosing k.
In the person classification example we’ve been looking at, we have 2 classes (Male and Female), so k = 2 (or a multiple of 2) is a bad idea right off the bat.
k = 1? Nah. You can’t have an election with just one candidate, can you?
k = 3? Yep. Works for me! Since there are only 3 slots, we’ll never have a tie between Male and Female. Also, 3 is a reasonable number of samples to consider for the person classification problem we’re dealing with (the way I see it).
A “small” value of k means that noise will have a higher influence on the result. A “large” value of k defeats the basic philosophy behind the KNN algorithm. There’s no rule for choosing k. It’s best to try out different values and see what works best.
Code
Let’s use the data from that table 👆 above…
import numpy as np
from collections import Counter

data = {"male": [[6.3, 50.2], [5.6, 47.1]],
        "female": [[5.9, 79.7], [5.1, 61.4], [5.1, 59.8]]}
NB: You need Numpy installed on your computer.
Next, let’s write a predict function. This function takes in the input feature set (Python list) we want to classify e.g [6.0, 52.1] -> [height, weight], as well as the value of k, and returns a class (Male or Female).
def predict(input_feature_set, k):
  distances = []

  for group in data:
    for training_feature_set in data[group]:
      euclidean_distance = np.linalg.norm(np.array(input_feature_set) - np.array(training_feature_set))
      distances.append([euclidean_distance, group])

  nearest = sorted(distances)[:k]
  votes = [d[1] for d in nearest]
  prediction = Counter(votes).most_common(1)[0][0]

  return prediction
Now that’s some chunk of code!
First things first! We loop through each training sample, calculating the Euclidean distance between it and the input set.
The euclidean distance between two points on a cartesian plane is given by:
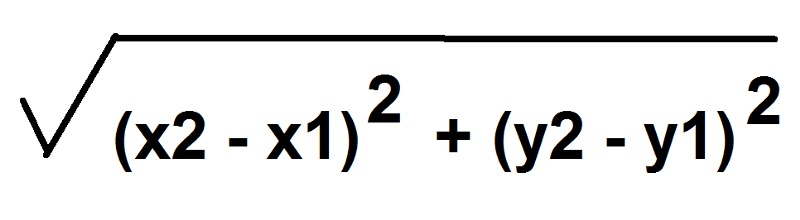
Sound familiar?
In the code, we used numpy’s euclidean distance function np.linalg.norm() for simplicity and efficiency.
Next, we append the distance along with the class/group of the set ([euclidean distance, group] -> [12.092364, “male”]) to distances list.
Afterwards, we sort distances in ascending order of magnitude and select the first k elements using sorted(distances)[:k].
Then we dispose the distances with the new votes variable using [d[1] for d in nearest]. We don’t need the numbers anymore, only the nearest classes/groups e.g [“male”, “female”, “male”].
Finally, we count the occurrences of each class in votes and return the class with the highest occurrence.
prediction = Counter(votes).most_common(1)[0][0]

return prediction
Predict
print(predict([6.0, 52.1], 3))
Accuracy
To find out how accurate a KNN classifier is, we can divide a given data set into training and testing data, then run the test data through the predict function, noting if the classifier got the class right or wrong. This can be used to calculate accuracy, like so:
accuracy = correct_predictions / test_sample_size * 100
Confidence
Confidence is, well how “confident” a KNN classifier is about a prediction. If we have k to be 3 and the nearest neighbors for a person classifier are female, male and female, we can say we’re 2/3 * 100 percent confident that the person is female. Likewise, if the nearest neighbors are all male, we can say we’re 100% confident that the person is a male.
Perf
While KNN produces good classifiers, it takes a lot of time to predict outputs for large data sets. This is because euclidean distance must be calculated for all training samples in order to find the “nearest” samples in the data.
Data sets
I suggest you try out KNN with a couple popular data sets to get a feel of how powerful the algorithm is. There are many free KNN data sets online like the Iris data set and the Breast Cancer Wisconsin (diagnostic) data set. You should totally check them out!
Don’t forget to check out the ML Chops repo for the complete KNN code: https://github.com/nicholaskajoh/ML_Chops/tree/master/k-nearest-neighbors.
If you have any questions, concerns or suggestions, don’t hesitate to comment! 👍
Last modified on 2023-03-14