We’ve been talking classification for a while now — from K Nearest Neighbors to Naive Bayes to Support Vector Machines. In this post, we’ll be looking at clustering using an algorithm called K Means. Let’s dive in…

The ML Chops series
- Linear Regression
- K Nearest Neighbors
- Naive Bayes
- Support Vector Machine
- K Means (this article)
K Means is an unsupervised learning algorithm that tries to cluster data into a specified number of groups, K based on feature similarity. The algorithm works iteratively to assign each data point to one of K groups. Each group is identified by a centroid (the center point of the group) and data points are grouped with the centroid they’re closest to. The centroids are determined during training through optimization.
NB: Unsupervised learning involves training an algorithm with unclassified or unlabeled data. It’s up to the algorithm to figure out a pattern in the data and, in the case of clustering, group similar data points together.
How it works
- First, we select the number of groups/clusters, K we want. To figure out what value of K to use, you can visualize the data to see how many groups it can be separated into. This is not always possible because the data can be in more than 3 dimensions. In such a case, you need to have an expectation from your data. Maybe you’re trying to separate good oranges from bad ones. In this case, K = 2.
- Next, we create K centroids. The easiest way to do this is to use the first K feature sets from our data or just do a random selection.
- These centroids are not optimized. The training process involves moving the centroids until they’re at the center of each group, at which point we can quite correctly determine what group a given data point should be in (the centroid to which it’s closest). With our starting centroids, we iterate through the data grouping each point to the centroid it’s closest to. Afterwards, we change the centroids by taking the mean of all the data points in each group.
- This process continues repetitively until we notice the centroids are not changing much or at all. This means we’re optimized!
Code
First things first, the data
import numpy as np

data = np.array([
    [4, 3], [0, 0], [2, 4], [3, 4], [5, 4], [-2, 1], [-3, 0], [-3, -3], [8, 12], [11, 11], [9, 10]
])
Visually, the above data looks like this
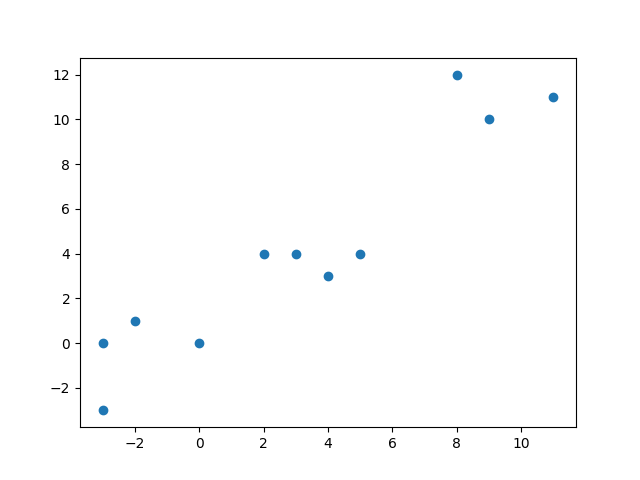
From the graph you can easily see the data can be grouped into 3 clusters. Thus K = 3.
K = 3
tol = 0.001
max_iter = 25
Notice the variables tol and max_ter. tol stands for tolerance and represents a percentage (0.001%). As we said earlier, we know we’re optimized when there’s little or no change in the centroids. If the change is greater than 0.001%, we tolerate and keep iterating.
But we can’t keep iterating forever/for too long in the case where we can’t optimize further and the change remains greater than 0.001. So we set max_iter, the maximum number of iterations we’re willing to do.
Next, let’s create the centroids. Their initial values would be the first K data points.
centroids = {}
for i in range(K):
    centroids[i] = data[i]
Now unto the meat of the algorithm which is the optimization
groups = {}
for i in range(max_iter):
    # step 1
    for j in range(K):
        groups[j] = []

    # step 2
    for feature_set in data:
        # step 2.1
        distances = [np.linalg.norm(feature_set - centroids[centroid_key]) for centroid_key in centroids]

        # step 2.2
        group = distances.index(min(distances))
        groups[group].append(feature_set)

    # step 3
    old_centroids = dict(centroids)

    # step 4
    for j in range(K):
        centroids[j] = np.average(groups[j], axis=0)

    # step 5
    optimized = True
    for centroid_key in centroids:
        old_centroid = old_centroids[centroid_key]
        new_centroid = centroids[centroid_key]
        a = np.array(new_centroid - old_centroid)
        b = np.array(old_centroid)
        change = np.divide(a, b, out=np.zeros_like(a), where=b!=0)

        if abs(np.sum(change * 100.0)) > tol:
            optimized = False
            break
    if optimized:
        break
Let break things down step by step…
Step 1
Initialize the groups dictionary with K empty arrays. This ensures groups is empty at the start of each iteration.
Step 2.1
Iterate through the data, calculating the euclidean distance of a given feature set from all the centroids.
Step 2.2
The feature set is added to the group of the centroid it’s closest to.
Step 3
Store the current centroids in old_centroids. The centroids are going to change soon. But we need the old centroids to see how much has changed since the last iteration.
Step 4
Calculate the new centroids by taking the average of all the feature sets in each centroid group.
Step 5
Check if the change in any of the centroids is greater than 0.001%. If yes, then we’re not yet optimized.
Here’s the full code for your perusal. It includes some lines of matplotlib code to visualize the data.
import numpy as np
import matplotlib.pyplot as plt
data = np.array([
[4, 3], [0, 0], [2, 4], [3, 4], [5, 4], [-2, 1], [-3, 0], [-3, -3], [8, 12], [11, 11], [9, 10]
])
K = 3
tol = 0.001
max_iter = 25
centroids = {}
for i in range(K):
centroids[i] = data[i]
groups = {}
for i in range(max_iter):
# step 1
for j in range(K):
groups[j] = []
# step 2
for feature_set in data:
# step 2.1
distances = [np.linalg.norm(feature_set - centroids[centroid_key]) for centroid_key in centroids]
# step 2.2
group = distances.index(min(distances))
groups[group].append(feature_set)
# step 3
old_centroids = dict(centroids)
# step 4
for j in range(K):
centroids[j] = np.average(groups[j], axis=0)
# step 5
optimized = True
for centroid_key in centroids:
old_centroid = old_centroids[centroid_key]
new_centroid = centroids[centroid_key]
a = np.array(new_centroid - old_centroid)
b = np.array(old_centroid)
change = np.divide(a, b, out=np.zeros_like(a), where=b!=0)
if abs(np.sum(change * 100.0)) > tol:
optimized = False
break
if optimized:
break
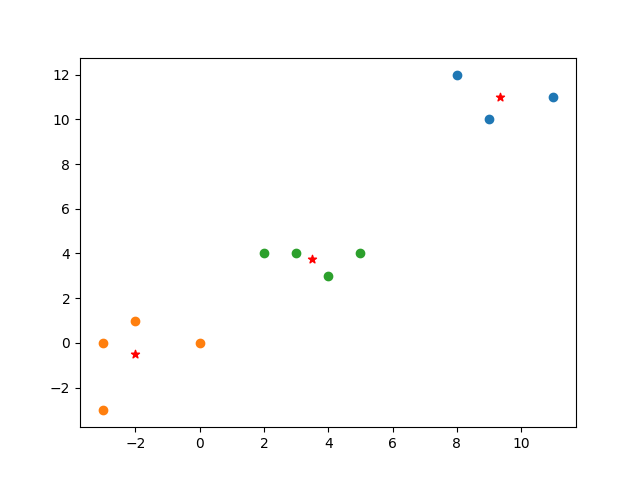
# visualize with matplotlib
plt.scatter([i[0] for i in groups[0]], [i[1] for i in groups[0]])
plt.scatter([i[0] for i in groups[1]], [i[1] for i in groups[1]])
plt.scatter([i[0] for i in groups[2]], [i[1] for i in groups[2]])
plt.scatter(centroids[0][0], centroids[0][1], color='r', marker='*')
plt.scatter(centroids[1][0], centroids[1][1], color='r', marker='*')
plt.scatter(centroids[2][0], centroids[2][1], color='r', marker='*')
plt.show()
Check out the ML Chops repo for a class-based implementation and an example with real world data: https://github.com/nicholaskajoh/ML_Chops/tree/master/k-means.
If you have any questions, concerns or suggestions, don’t hesitate to comment! 👍
Last modified on 2023-03-14